Overview:
I reran the sysbench fileio benchmarking tool on a large EC2 instance. This is basically the middle range offering from Amazon. The large instance runs a 64 bit OS of your choice and safely sits in the commodity PC/Server range (with a little extra memory).
If you missed the first article, I ran the same sysbench fileio benchmark on the small EC2 instance
Install:
- Follow the instructions to install sysbench from that article.
- Grab to shell script which will run the same tests.
- Run baby run.
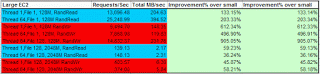
Summary:
- The root partition mountpoint still is much much better than the /mnt
- The large instance outperforms the small instance by a large margin.
- There was no improvement in the /mnt performance between small and large EC2 instance.
Results:
Raw Results:
(with EC2 large instance CPU/Memory and disk specification)
[root@ip-10-251-159-159 ~]# uname -a
Linux ip-10-251-159-159 2.6.16.33-xenU #2 SMP Wed Aug 15 17:27:36 SAST 2007 x86_64 x86_64 x86_64 GNU/Linux
[root@ip-10-251-159-159 ~]# df -h
Filesystem            Size  Used Avail Use% Mounted on
/dev/sda1             9.9G  767M  8.6G   9% /
/dev/sdb              414G  199M  393G   1% /mnt
[root@ip-10-251-159-159 ~]# cat /proc/cpuinfo
processor       : 0
vendor_id       : AuthenticAMD
cpu family      : 15
model           : 33
model name      : Dual Core AMD Opteron(tm) Processor 270
stepping        : 2
cpu MHz         : 2004.540
cache size      : 1024 KB
physical id     : 0
siblings        : 1
core id         : 0
cpu cores       : 1
fpu             : yes
fpu_exception   : yes
cpuid level     : 1
wp              : yes
flags           : fpu tsc msr pae mce cx8 apic mca cmov pat pse36 clflush mmx fxsr sse sse2 ht syscall nx mmxext fxsr_opt lm 3dnowext 3dnow pni lahf_lm cmp_legacy
bogomips        : 4009.78
TLB size        : 1024 4K pages
clflush size    : 64
cache_alignment : 64
address sizes   : 40 bits physical, 48 bits virtual
power management: ts fid vid ttp

processor       : 1
vendor_id       : AuthenticAMD
cpu family      : 15
model           : 33
model name      : Dual Core AMD Opteron(tm) Processor 270
stepping        : 2
cpu MHz         : 2004.540
cache size      : 1024 KB
physical id     : 1
siblings        : 1
core id         : 0
cpu cores       : 1
fpu             : yes
fpu_exception   : yes
cpuid level     : 1
wp              : yes
flags           : fpu tsc msr pae mce cx8 apic mca cmov pat pse36 clflush mmx fxsr sse sse2 ht syscall nx mmxext fxsr_opt lm 3dnowext 3dnow pni lahf_lm cmp_legacy
bogomips        : 4009.78
TLB size        : 1024 4K pages
clflush size    : 64
cache_alignment : 64
address sizes   : 40 bits physical, 48 bits virtual
power management: ts fid vid ttp

[root@ip-10-251-159-159 ~]# free
           total       used       free     shared    buffers     cached
Mem:       7864320     218748    7645572          0       3664      37612
-/+ buffers/cache:     177472    7686848
Swap:            0          0          0

[root@ip-10-251-159-159 ~]# cat /proc/meminfo
MemTotal:      7864320 kB
MemFree:       7645572 kB
Buffers:          3680 kB
Cached:          37596 kB
SwapCached:          0 kB
Active:          29264 kB
Inactive:        15376 kB
HighTotal:           0 kB
HighFree:            0 kB
LowTotal:      7864320 kB
LowFree:       7645572 kB
SwapTotal:           0 kB
SwapFree:            0 kB
Dirty:              28 kB
Writeback:           0 kB
Mapped:           6584 kB
Slab:             9344 kB
CommitLimit:   3932160 kB
Committed_AS:     9304 kB
PageTables:        604 kB
VmallocTotal: 34359738367 kB
VmallocUsed:       124 kB
VmallocChunk: 34359738243 kB

[root@ip-10-251-159-159 ~]# cat /etc/fstab
# Default /etc/fstab
# Supplied by: Amazon EC2 public image
/dev/sda1 /     ext3    defaults 1 1
/dev/sdb  /mnt  ext3    defaults 0 0
none      /proc proc    defaults 0 0
none      /sys  sysfs   defaults 0 0

 Test on /dev/sda1

[root@ip-10-251-159-159 bench]# ./sysbench_fileio.sh
sysbench v0.4.8:  multi-threaded system evaluation benchmark

1 files, 131072Kb each, 128Mb total
Creating files for the test...
sysbench v0.4.8:  multi-threaded system evaluation benchmark

Running the test with following options:
Number of threads: 1

Extra file open flags: 16384
1 files, 128Mb each
128Mb total file size
Block size 16Kb
Number of random requests for random IO: 1000000
Read/Write ratio for combined random IO test: 1.50
Calling fsync() at the end of test, Enabled.
Using synchronous I/O mode
Doing random read test
Threads started!
Time limit exceeded, exiting...
Done.

Operations performed:  785793 Read, 0 Write, 0 Other = 785793 Total
Read 11.99Gb  Written 0b  Total transferred 11.99Gb  (204.63Mb/sec)
13096.48 Requests/sec executed

Test execution summary:
  total time:                          60.0003s
  total number of events:              785793
  total time taken by event execution: 57.9662
  per-request statistics:
       min:                            0.0001s
       avg:                            0.0001s
       max:                            0.0600s
       approx.  95 percentile:         0.0001s

Threads fairness:
  events (avg/stddev):           785793.0000/0.00
  execution time (avg/stddev):   57.9662/0.00

sysbench v0.4.8:  multi-threaded system evaluation benchmark

Running the test with following options:
Number of threads: 64

Extra file open flags: 16384
1 files, 128Mb each
128Mb total file size
Block size 16Kb
Number of random requests for random IO: 1000000
Read/Write ratio for combined random IO test: 1.50
Calling fsync() at the end of test, Enabled.
Using synchronous I/O mode
Doing random read test
Threads started!
Done.

Operations performed:  1000000 Read, 0 Write, 0 Other = 1000000 Total
Read 15.259Gb  Written 0b  Total transferred 15.259Gb  (394.52Mb/sec)
25248.99 Requests/sec executed

Test execution summary:
  total time:                          39.6055s
  total number of events:              1000000
  total time taken by event execution: 2531.7466
  per-request statistics:
       min:                            0.0001s
       avg:                            0.0025s
       max:                            0.0387s
       approx.  95 percentile:         0.0027s

Threads fairness:
  events (avg/stddev):           15625.0000/2.60
  execution time (avg/stddev):   39.5585/0.00

sysbench v0.4.8:  multi-threaded system evaluation benchmark

Running the test with following options:
Number of threads: 1

Extra file open flags: 16384
1 files, 128Mb each
128Mb total file size
Block size 16Kb
Number of random requests for random IO: 1000000
Read/Write ratio for combined random IO test: 1.50
Calling fsync() at the end of test, Enabled.
Using synchronous I/O mode
Doing random write test
Threads started!
Time limit exceeded, exiting...
Done.

Operations performed:  0 Read, 623302 Write, 0 Other = 623302 Total
Read 0b  Written 9.5108Gb  Total transferred 9.5108Gb  (148.35Mb/sec)
9494.70 Requests/sec executed

Test execution summary:
  total time:                          65.6474s
  total number of events:              623302
  total time taken by event execution: 64.1263
  per-request statistics:
       min:                            0.0001s
       avg:                            0.0001s
       max:                            12.6994s
       approx.  95 percentile:         0.0001s

Threads fairness:
  events (avg/stddev):           623302.0000/0.00
  execution time (avg/stddev):   64.1263/0.00

sysbench v0.4.8:  multi-threaded system evaluation benchmark

Running the test with following options:
Number of threads: 64

Extra file open flags: 16384
1 files, 128Mb each
128Mb total file size
Block size 16Kb
Number of random requests for random IO: 1000000
Read/Write ratio for combined random IO test: 1.50
Calling fsync() at the end of test, Enabled.
Using synchronous I/O mode
Doing random write test
Threads started!
Time limit exceeded, exiting...
(last message repeated 63 times)
Done.

Operations performed:  0 Read, 460201 Write, 0 Other = 460201 Total
Read 0b  Written 7.0221Gb  Total transferred 7.0221Gb  (119.83Mb/sec)
7668.98 Requests/sec executed

Test execution summary:
  total time:                          60.0081s
  total number of events:              460201
  total time taken by event execution: 3838.8304
  per-request statistics:
       min:                            0.0001s
       avg:                            0.0083s
       max:                            59.9959s
       approx.  95 percentile:         0.0001s

Threads fairness:
  events (avg/stddev):           7190.6406/10250.84
  execution time (avg/stddev):   59.9817/0.03

sysbench v0.4.8:  multi-threaded system evaluation benchmark

Removing test files...
sysbench v0.4.8:  multi-threaded system evaluation benchmark

128 files, 1024Kb each, 128Mb total
Creating files for the test...
sysbench v0.4.8:  multi-threaded system evaluation benchmark

Running the test with following options:
Number of threads: 64

Extra file open flags: 16384
128 files, 1Mb each
128Mb total file size
Block size 16Kb
Number of random requests for random IO: 1000000
Read/Write ratio for combined random IO test: 1.50
Calling fsync() at the end of test, Enabled.
Using synchronous I/O mode
Doing random write test
Threads started!
Time limit exceeded, exiting...
(last message repeated 63 times)
Done.

Operations performed:  0 Read, 890007 Write, 0 Other = 890007 Total
Read 0b  Written 13.58Gb  Total transferred 13.58Gb  (231.76Mb/sec)
14832.37 Requests/sec executed

Test execution summary:
  total time:                          60.0044s
  total number of events:              890007
  total time taken by event execution: 3837.5238
  per-request statistics:
       min:                            0.0003s
       avg:                            0.0043s
       max:                            15.4482s
       approx.  95 percentile:         0.0056s

Threads fairness:
  events (avg/stddev):           13906.3594/53.51
  execution time (avg/stddev):   59.9613/0.00

sysbench v0.4.8:  multi-threaded system evaluation benchmark

128 files, 16384Kb each, 2048Mb total
Creating files for the test...
sysbench v0.4.8:  multi-threaded system evaluation benchmark

Running the test with following options:
Number of threads: 1

Extra file open flags: 16384
128 files, 16Mb each
2Gb total file size
Block size 16Kb
Number of random requests for random IO: 1000000
Read/Write ratio for combined random IO test: 1.50
Calling fsync() at the end of test, Enabled.
Using synchronous I/O mode
Doing random read test
Threads started!
Time limit exceeded, exiting...
Done.

Operations performed:  8349 Read, 0 Write, 0 Other = 8349 Total
Read 130.45Mb  Written 0b  Total transferred 130.45Mb  (2.1739Mb/sec)
139.13 Requests/sec executed

Test execution summary:
  total time:                          60.0086s
  total number of events:              8349
  total time taken by event execution: 59.9863
  per-request statistics:
       min:                            0.0001s
       avg:                            0.0072s
       max:                            1.4351s
       approx.  95 percentile:         0.0127s

Threads fairness:
  events (avg/stddev):           8349.0000/0.00
  execution time (avg/stddev):   59.9863/0.00

sysbench v0.4.8:  multi-threaded system evaluation benchmark

Running the test with following options:
Number of threads: 64

Extra file open flags: 16384
128 files, 16Mb each
2Gb total file size
Block size 16Kb
Number of random requests for random IO: 1000000
Read/Write ratio for combined random IO test: 1.50
Calling fsync() at the end of test, Enabled.
Using synchronous I/O mode
Doing random read test
Threads started!
Time limit exceeded, exiting...
(last message repeated 63 times)
Done.

Operations performed:  8953 Read, 0 Write, 0 Other = 8953 Total
Read 139.89Mb  Written 0b  Total transferred 139.89Mb  (2.3145Mb/sec)
148.13 Requests/sec executed

Test execution summary:
  total time:                          60.4417s
  total number of events:              8953
  total time taken by event execution: 3859.6431
  per-request statistics:
       min:                            0.0062s
       avg:                            0.4311s
       max:                            1.0842s
       approx.  95 percentile:         0.6042s

Threads fairness:
  events (avg/stddev):           139.8906/1.52
  execution time (avg/stddev):   60.3069/0.17

sysbench v0.4.8:  multi-threaded system evaluation benchmark

Running the test with following options:
Number of threads: 1

Extra file open flags: 16384
128 files, 16Mb each
2Gb total file size
Block size 16Kb
Number of random requests for random IO: 1000000
Read/Write ratio for combined random IO test: 1.50
Calling fsync() at the end of test, Enabled.
Using synchronous I/O mode
Doing random write test
Threads started!
Time limit exceeded, exiting...
Done.

Operations performed:  0 Read, 25372 Write, 0 Other = 25372 Total
Read 0b  Written 396.44Mb  Total transferred 396.44Mb  (6.3057Mb/sec)
403.57 Requests/sec executed

Test execution summary:
  total time:                          62.8695s
  total number of events:              25372
  total time taken by event execution: 62.8041
  per-request statistics:
       min:                            0.0001s
       avg:                            0.0025s
       max:                            6.2624s
       approx.  95 percentile:         0.0001s

Threads fairness:
  events (avg/stddev):           25372.0000/0.00
  execution time (avg/stddev):   62.8041/0.00

sysbench v0.4.8:  multi-threaded system evaluation benchmark

Running the test with following options:
Number of threads: 64

Extra file open flags: 16384
128 files, 16Mb each
2Gb total file size
Block size 16Kb
Number of random requests for random IO: 1000000
Read/Write ratio for combined random IO test: 1.50
Calling fsync() at the end of test, Enabled.
Using synchronous I/O mode
Doing random write test
Threads started!
Time limit exceeded, exiting...
(last message repeated 63 times)
Done.

Operations performed:  0 Read, 22442 Write, 0 Other = 22442 Total
Read 0b  Written 350.66Mb  Total transferred 350.66Mb  (5.8438Mb/sec)
374.00 Requests/sec executed

Test execution summary:
  total time:                          60.0046s
  total number of events:              22442
  total time taken by event execution: 3839.7357
  per-request statistics:
       min:                            0.0013s
       avg:                            0.1711s
       max:                            40.0358s
       approx.  95 percentile:         0.0841s

Threads fairness:
  events (avg/stddev):           350.6562/8.07
  execution time (avg/stddev):   59.9959/0.00

sysbench v0.4.8:  multi-threaded system evaluation benchmark

Removing test files...


 On /mnt

[root@ip-10-251-159-159 bench]# cd /mnt
[root@ip-10-251-159-159 mnt]# mkdir bench
[root@ip-10-251-159-159 mnt]# cd bench/
[root@ip-10-251-159-159 bench]# cp ~/bench/sysbench_fileio.sh .
[root@ip-10-251-159-159 bench]# ./sysbench_fileio.sh
sysbench v0.4.8:  multi-threaded system evaluation benchmark

1 files, 131072Kb each, 128Mb total
Creating files for the test...
sysbench v0.4.8:  multi-threaded system evaluation benchmark

Running the test with following options:
Number of threads: 1

Extra file open flags: 16384
1 files, 128Mb each
128Mb total file size
Block size 16Kb
Number of random requests for random IO: 1000000
Read/Write ratio for combined random IO test: 1.50
Calling fsync() at the end of test, Enabled.
Using synchronous I/O mode
Doing random read test
Threads started!
Time limit exceeded, exiting...
Done.

Operations performed:  9686 Read, 0 Write, 0 Other = 9686 Total
Read 151.34Mb  Written 0b  Total transferred 151.34Mb  (2.5224Mb/sec)
161.43 Requests/sec executed

Test execution summary:
  total time:                          60.0009s
  total number of events:              9686
  total time taken by event execution: 59.9755
  per-request statistics:
       min:                            0.0003s
       avg:                            0.0062s
       max:                            0.1398s
       approx.  95 percentile:         0.0100s

Threads fairness:
  events (avg/stddev):           9686.0000/0.00
  execution time (avg/stddev):   59.9755/0.00

sysbench v0.4.8:  multi-threaded system evaluation benchmark

Running the test with following options:
Number of threads: 64

Extra file open flags: 16384
1 files, 128Mb each
128Mb total file size
Block size 16Kb
Number of random requests for random IO: 1000000
Read/Write ratio for combined random IO test: 1.50
Calling fsync() at the end of test, Enabled.
Using synchronous I/O mode
Doing random read test
Threads started!
Time limit exceeded, exiting...
(last message repeated 63 times)
Done.

Operations performed:  10849 Read, 0 Write, 0 Other = 10849 Total
Read 169.52Mb  Written 0b  Total transferred 169.52Mb  (2.8097Mb/sec)
179.82 Requests/sec executed

Test execution summary:
  total time:                          60.3318s
  total number of events:              10849
  total time taken by event execution: 3850.1830
  per-request statistics:
       min:                            0.0077s
       avg:                            0.3549s
       max:                            0.7746s
       approx.  95 percentile:         0.4958s

Threads fairness:
  events (avg/stddev):           169.5156/3.16
  execution time (avg/stddev):   60.1591/0.10

sysbench v0.4.8:  multi-threaded system evaluation benchmark

Running the test with following options:
Number of threads: 1

Extra file open flags: 16384
1 files, 128Mb each
128Mb total file size
Block size 16Kb
Number of random requests for random IO: 1000000
Read/Write ratio for combined random IO test: 1.50
Calling fsync() at the end of test, Enabled.
Using synchronous I/O mode
Doing random write test
Threads started!
Time limit exceeded, exiting...
Done.

Operations performed:  0 Read, 15936 Write, 0 Other = 15936 Total
Read 0b  Written 249Mb  Total transferred 249Mb  (4.1233Mb/sec)
263.89 Requests/sec executed

Test execution summary:
  total time:                          60.3881s
  total number of events:              15936
  total time taken by event execution: 60.3480
  per-request statistics:
       min:                            0.0001s
       avg:                            0.0038s
       max:                            0.8638s
       approx.  95 percentile:         0.0002s

Threads fairness:
  events (avg/stddev):           15936.0000/0.00
  execution time (avg/stddev):   60.3480/0.00

sysbench v0.4.8:  multi-threaded system evaluation benchmark

Running the test with following options:
Number of threads: 64

Extra file open flags: 16384
1 files, 128Mb each
128Mb total file size
Block size 16Kb
Number of random requests for random IO: 1000000
Read/Write ratio for combined random IO test: 1.50
Calling fsync() at the end of test, Enabled.
Using synchronous I/O mode
Doing random write test
Threads started!
Time limit exceeded, exiting...
(last message repeated 63 times)
Done.

Operations performed:  0 Read, 16206 Write, 0 Other = 16206 Total
Read 0b  Written 253.22Mb  Total transferred 253.22Mb  (4.1737Mb/sec)
267.12 Requests/sec executed

Test execution summary:
  total time:                          60.6696s
  total number of events:              16206
  total time taken by event execution: 3881.9322
  per-request statistics:
       min:                            0.0001s
       avg:                            0.2395s
       max:                            60.6637s
       approx.  95 percentile:         0.0002s

Threads fairness:
  events (avg/stddev):           253.2188/1423.67
  execution time (avg/stddev):   60.6552/0.02

sysbench v0.4.8:  multi-threaded system evaluation benchmark

Removing test files...
sysbench v0.4.8:  multi-threaded system evaluation benchmark

128 files, 1024Kb each, 128Mb total
Creating files for the test...
sysbench v0.4.8:  multi-threaded system evaluation benchmark

Running the test with following options:
Number of threads: 64

Extra file open flags: 16384
128 files, 1Mb each
128Mb total file size
Block size 16Kb
Number of random requests for random IO: 1000000
Read/Write ratio for combined random IO test: 1.50
Calling fsync() at the end of test, Enabled.
Using synchronous I/O mode
Doing random write test
Threads started!
Time limit exceeded, exiting...
(last message repeated 63 times)
Done.

Operations performed:  0 Read, 14826 Write, 0 Other = 14826 Total
Read 0b  Written 231.66Mb  Total transferred 231.66Mb  (3.828Mb/sec)
244.99 Requests/sec executed

Test execution summary:
  total time:                          60.5170s
  total number of events:              14826
  total time taken by event execution: 3855.8588
  per-request statistics:
       min:                            0.0004s
       avg:                            0.2601s
       max:                            1.7562s
       approx.  95 percentile:         0.7735s

Threads fairness:
  events (avg/stddev):           231.6562/6.36
  execution time (avg/stddev):   60.2478/0.08

sysbench v0.4.8:  multi-threaded system evaluation benchmark

128 files, 16384Kb each, 2048Mb total
Creating files for the test...
sysbench v0.4.8:  multi-threaded system evaluation benchmark

Running the test with following options:
Number of threads: 1

Extra file open flags: 16384
128 files, 16Mb each
2Gb total file size
Block size 16Kb
Number of random requests for random IO: 1000000
Read/Write ratio for combined random IO test: 1.50
Calling fsync() at the end of test, Enabled.
Using synchronous I/O mode
Doing random read test
Threads started!
Time limit exceeded, exiting...
Done.

Operations performed:  8373 Read, 0 Write, 0 Other = 8373 Total
Read 130.83Mb  Written 0b  Total transferred 130.83Mb  (2.1804Mb/sec)
139.54 Requests/sec executed

Test execution summary:
  total time:                          60.0027s
  total number of events:              8373
  total time taken by event execution: 59.9801
  per-request statistics:
       min:                            0.0003s
       avg:                            0.0072s
       max:                            0.4734s
       approx.  95 percentile:         0.0107s

Threads fairness:
  events (avg/stddev):           8373.0000/0.00
  execution time (avg/stddev):   59.9801/0.00

sysbench v0.4.8:  multi-threaded system evaluation benchmark

Running the test with following options:
Number of threads: 64

Extra file open flags: 16384
128 files, 16Mb each
2Gb total file size
Block size 16Kb
Number of random requests for random IO: 1000000
Read/Write ratio for combined random IO test: 1.50
Calling fsync() at the end of test, Enabled.
Using synchronous I/O mode
Doing random read test
Threads started!
Time limit exceeded, exiting...
(last message repeated 63 times)
Done.

Operations performed:  10034 Read, 0 Write, 0 Other = 10034 Total
Read 156.78Mb  Written 0b  Total transferred 156.78Mb  (2.5952Mb/sec)
166.09 Requests/sec executed

Test execution summary:
  total time:                          60.4118s
  total number of events:              10034
  total time taken by event execution: 3855.7836
  per-request statistics:
       min:                            0.0066s
       avg:                            0.3843s
       max:                            1.0552s
       approx.  95 percentile:         0.5357s

Threads fairness:
  events (avg/stddev):           156.7812/2.78
  execution time (avg/stddev):   60.2466/0.10

sysbench v0.4.8:  multi-threaded system evaluation benchmark

Running the test with following options:
Number of threads: 1

Extra file open flags: 16384
128 files, 16Mb each
2Gb total file size
Block size 16Kb
Number of random requests for random IO: 1000000
Read/Write ratio for combined random IO test: 1.50
Calling fsync() at the end of test, Enabled.
Using synchronous I/O mode
Doing random write test
Threads started!
Time limit exceeded, exiting...
Done.

Operations performed:  0 Read, 12932 Write, 0 Other = 12932 Total
Read 0b  Written 202.06Mb  Total transferred 202.06Mb  (3.3463Mb/sec)
214.16 Requests/sec executed

Test execution summary:
  total time:                          60.3847s
  total number of events:              12932
  total time taken by event execution: 60.3509
  per-request statistics:
       min:                            0.0002s
       avg:                            0.0047s
       max:                            3.6623s
       approx.  95 percentile:         0.0002s

Threads fairness:
  events (avg/stddev):           12932.0000/0.00
  execution time (avg/stddev):   60.3509/0.00

sysbench v0.4.8:  multi-threaded system evaluation benchmark

Running the test with following options:
Number of threads: 64

Extra file open flags: 16384
128 files, 16Mb each
2Gb total file size
Block size 16Kb
Number of random requests for random IO: 1000000
Read/Write ratio for combined random IO test: 1.50
Calling fsync() at the end of test, Enabled.
Using synchronous I/O mode
Doing random write test
Threads started!
Time limit exceeded, exiting...
(last message repeated 63 times)
Done.

Operations performed:  0 Read, 13200 Write, 0 Other = 13200 Total
Read 0b  Written 206.25Mb  Total transferred 206.25Mb  (3.4138Mb/sec)
218.48 Requests/sec executed

Test execution summary:
  total time:                          60.4171s
  total number of events:              13200
  total time taken by event execution: 3864.5972
  per-request statistics:
       min:                            0.0003s
       avg:                            0.2928s
       max:                            3.7448s
       approx.  95 percentile:         2.3343s

Threads fairness:
  events (avg/stddev):           206.2500/5.68
  execution time (avg/stddev):   60.3843/0.01

sysbench v0.4.8:  multi-threaded system evaluation benchmark

Removing test files...

